
Key Takeaways
- Open Doors reported 78,583 China-origin undergraduate students in 2024/25, 47.0% fewer than in 2019/20.
- Statistics Canada recorded 44,709 bachelor's or equivalent program enrolments among international students with Chinese citizenship in 2023/24, 28.2% below 2019/20.
- The two series share a downward direction, but they measure different populations and cannot be added into a North American total.
- Applicants from China on Common App increased 7% in 2024/25, their first year-over-year increase since 2017/18. This is an application-stage signal, not evidence of enrollment recovery.
- Chinese K-12 SEVIS records in the United States were 60.6% lower in 2024 than in 2019. The series describes a smaller early-stage population, but it does not forecast future undergraduate enrollment.
Measurement Before Comparison
North American undergraduate mobility cannot be measured with one harmonized dataset. This analysis therefore compares changes within each official source and keeps the statistical populations separate.
Open Doors counts China-origin undergraduate students reported by U.S. higher education institutions across an academic year. Statistics Canada reports fall-snapshot program enrolments among international students with Chinese citizenship. Its counts are randomly rounded to a multiple of three, and a student can appear in more than one program during the reporting period.
| Indicator | Population and unit | Period | Change used here |
|---|---|---|---|
| U.S. undergraduate | China-origin undergraduate students reported in Open Doors | 2019/20 to 2024/25 | 148,160 to 78,583 (−47.0%) |
| Canada bachelor's or equivalent | Fall-snapshot program enrolments among international students with Chinese citizenship | 2019/20 to 2023/24 | 62,298 to 44,709 (−28.2%) |
| Common App applicants | Distinct first-year applicants from China using Common App | 2023/24 to 2024/25 | +7% year over year |
| U.S. K-12 SEVIS | Active Chinese K-12 F/M records | 2019 to 2024 | 36,842 to 14,515 (−60.6%) |
Method note: all changes are calculated within one source and one definition. The indexed comparison sets each enrolled-population series to 100 in 2019/20; it does not convert the underlying counts into a shared population. Common App applicants and SEVIS records are shown only as separate stage indicators.
The U.S. Undergraduate Contraction
China-origin undergraduate numbers nearly halved in the U.S.
Swipe horizontally to view the full chart
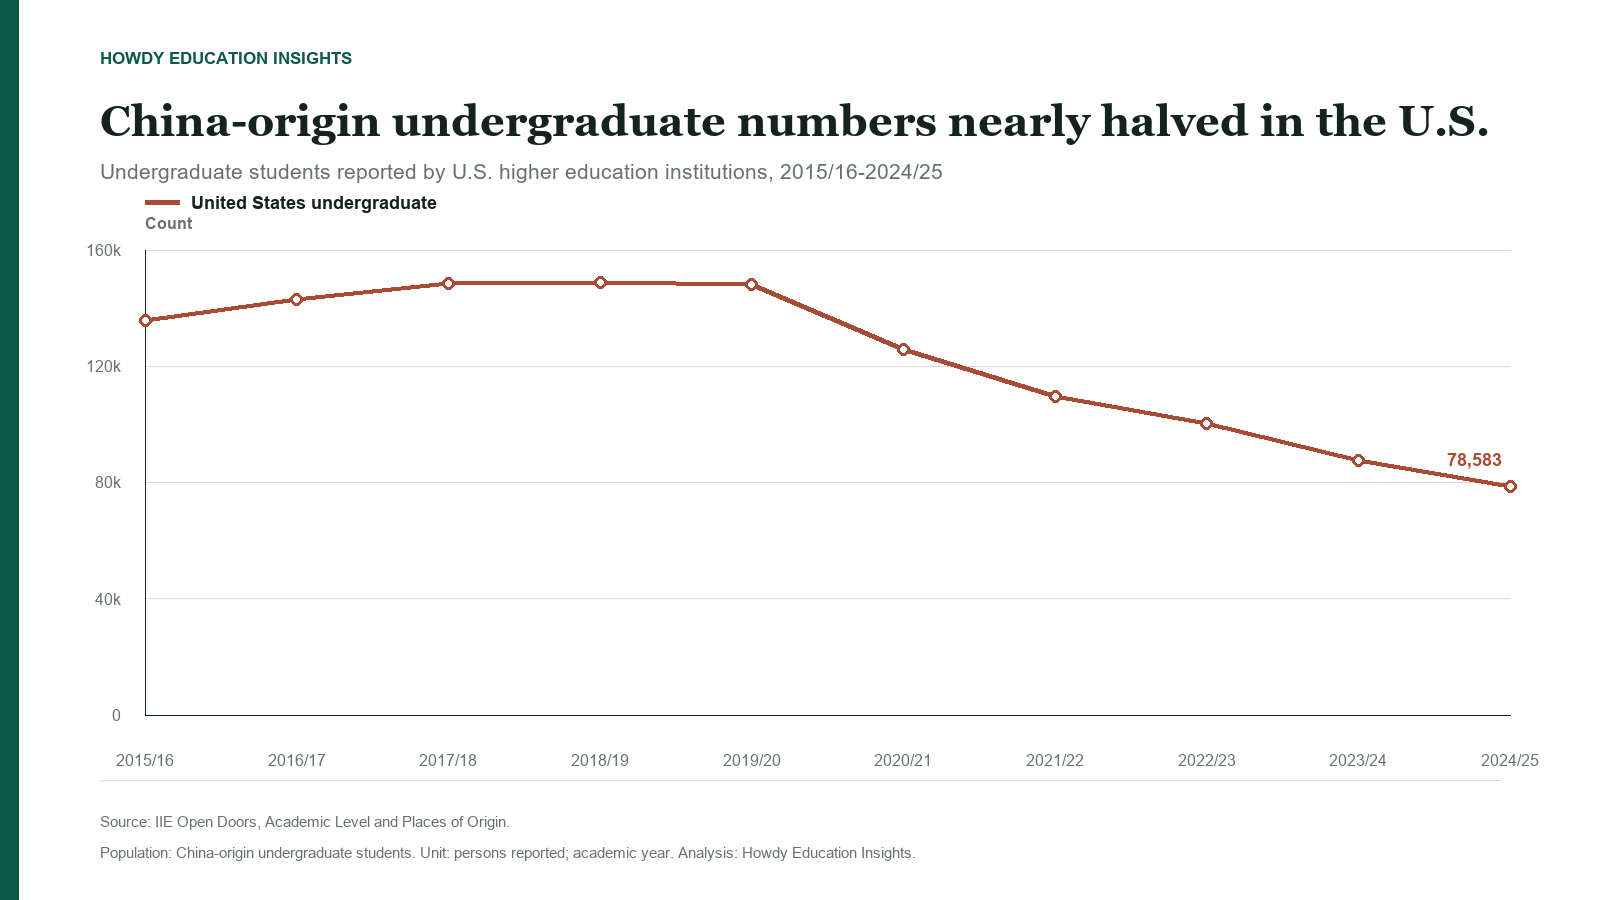
The U.S. undergraduate series was already close to flat before the pandemic. It rose from 148,593 in 2017/18 to 148,880 in 2018/19, then edged down to 148,160 in 2019/20.
The decline accelerated from 2020/21 onward. Open Doors reported 125,616 undergraduate students in 2020/21 and 78,583 in 2024/25. The five-year contraction from the 2019/20 baseline was 69,577 students, or 47.0%.
The data establish the scale and timing of the contraction. They do not identify how cost, safety, academic value, employment expectations or other considerations contributed to it.
Canada Followed a Different Timetable
Bachelor's-level enrolments also declined in Canada
Swipe horizontally to view the full chart
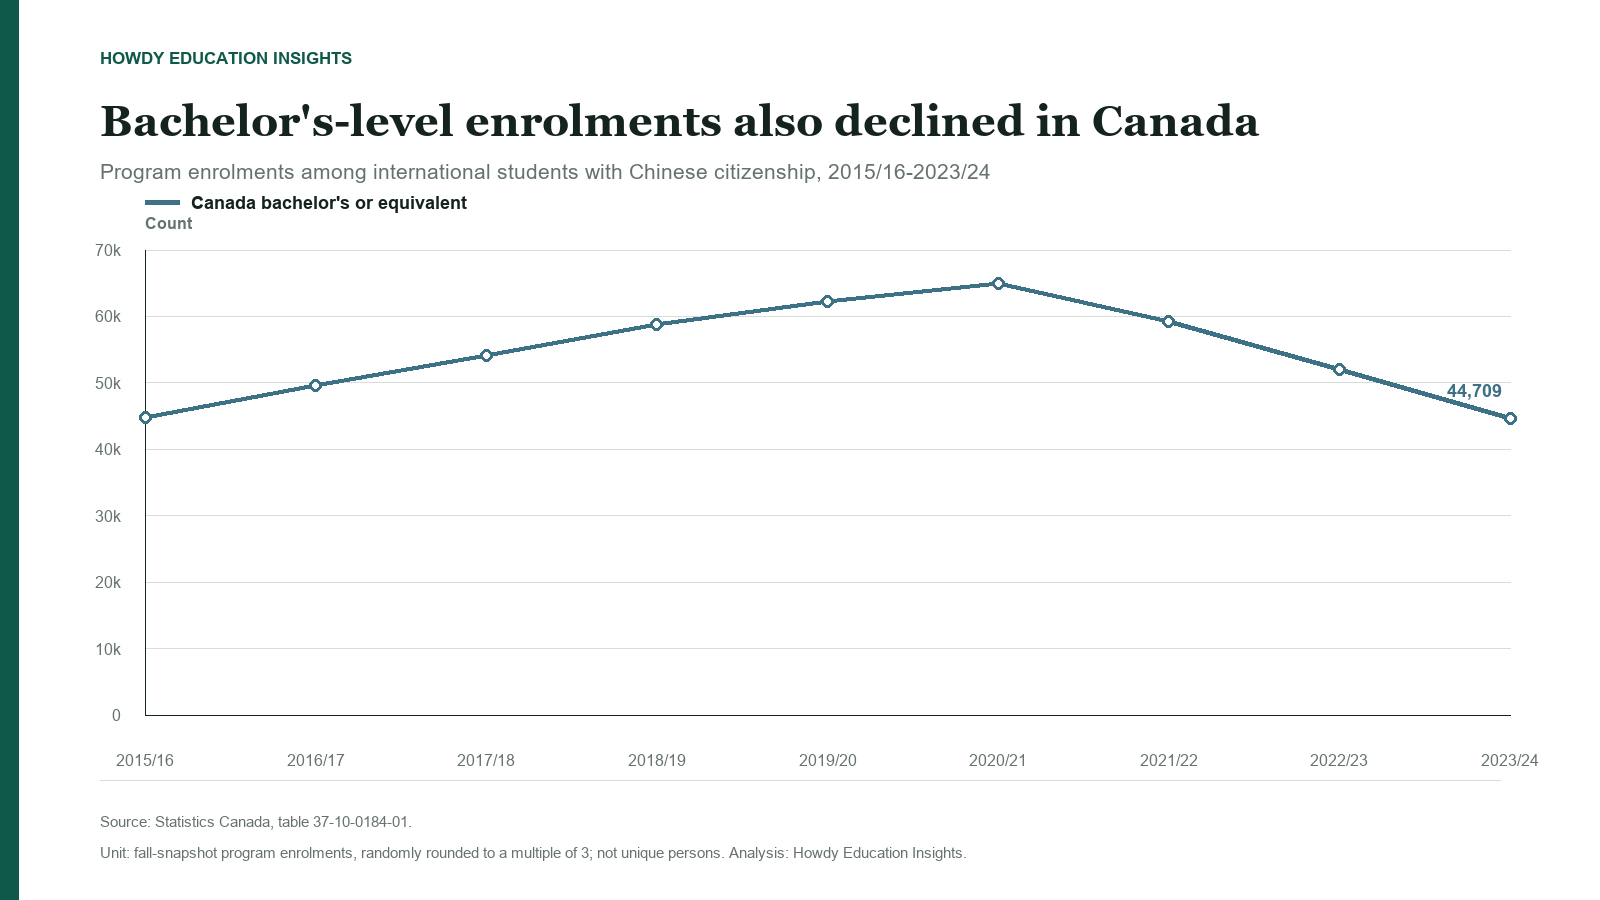
Canada's series did not turn at exactly the same time. Bachelor's or equivalent enrolments increased from 62,298 in 2019/20 to 64,929 in 2020/21, then declined for three consecutive reporting periods.
By 2023/24, the count had fallen to 44,709. That was 28.2% below 2019/20 and 31.1% below the 2020/21 peak. The level remained the largest component of China-citizenship postsecondary enrolments, accounting for roughly two thirds of the 66,606 total recorded that year.
These are program enrolments rather than unique students or study permits. They describe the academic structure captured in the fall snapshot and should not be treated as a count of newly arriving bachelor's students.
A Shared Direction, Not a Combined Market
Both series moved below their 2019/20 baselines
Swipe horizontally to view the full chart
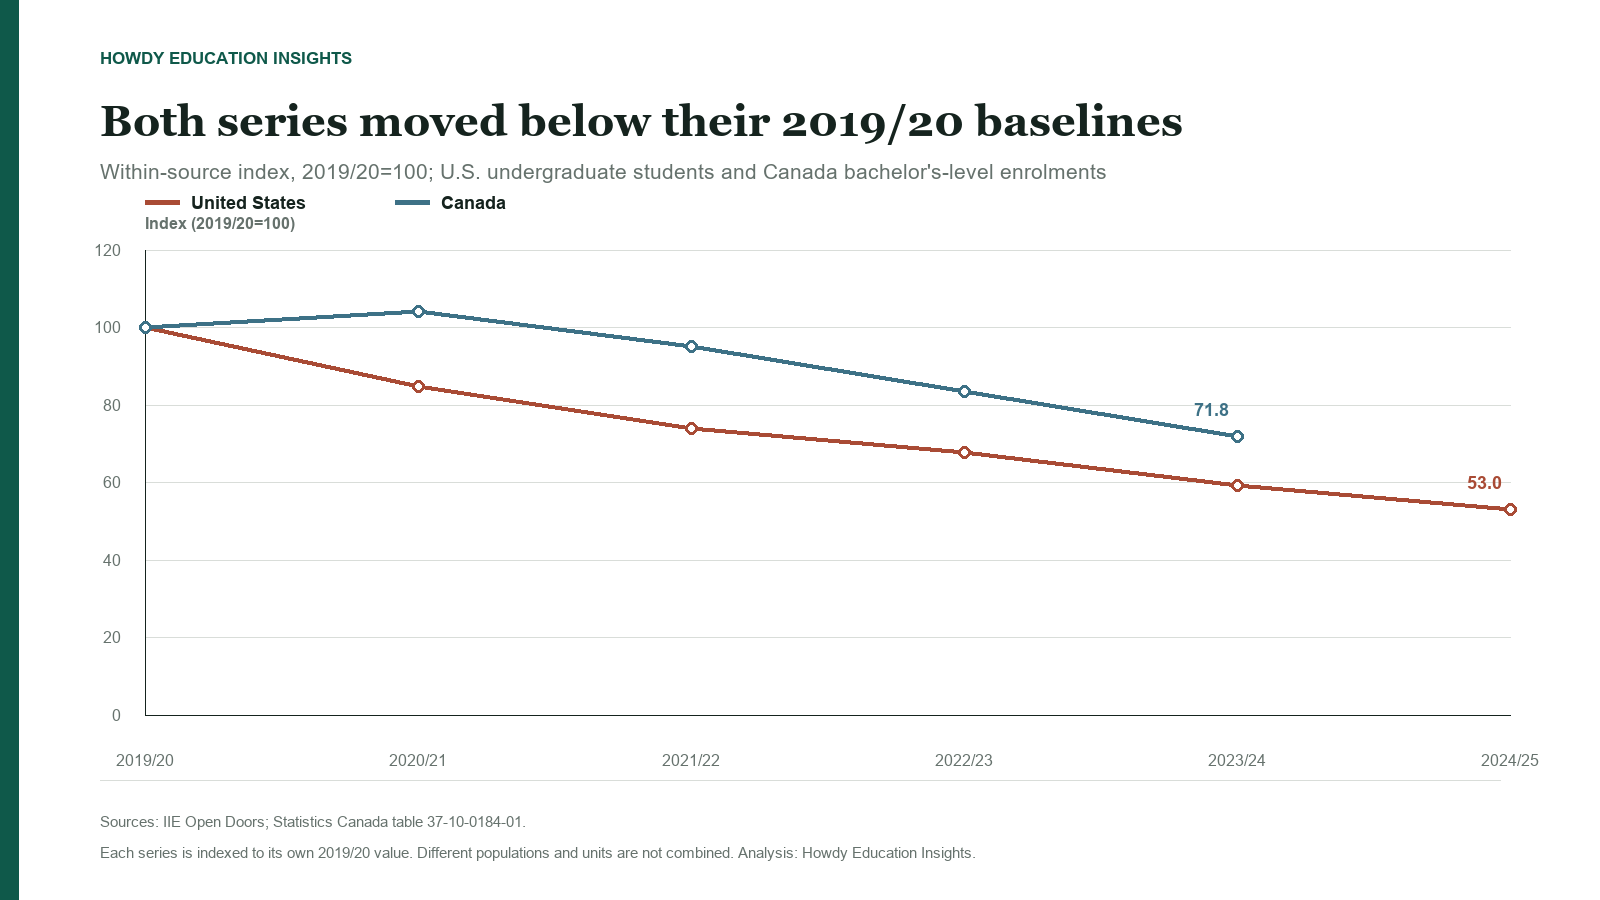
Indexing each source to its own 2019/20 value makes direction and relative scale easier to compare without combining the counts. By 2023/24, the U.S. index had fallen to 59.1 and the Canadian index to 71.8. The Statistics Canada series used here ends in 2023/24, so the U.S. 2024/25 endpoint has no Canadian counterpart in this comparison.
The result supports a limited North American conclusion: the China-origin undergraduate or bachelor's-level population was substantially smaller in both systems than around 2019/20, with a deeper measured contraction in the United States. It does not establish that students shifted directly between the two countries or that the same causes produced both declines.
Earlier and Later Signals
An earlier-stage population also became smaller
Active Chinese K-12 SEVIS records in the United States fell from 36,842 in 2019 to 14,515 in 2024, a decline of 60.6%. This is relevant context for schools recruiting from China, but the records do not form a deterministic pipeline into U.S. or Canadian undergraduate education.
Application activity recently moved in the opposite direction
Common App reported a 7% increase in applicants from China in 2024/25, the first year-over-year growth since 2017/18. The report covers distinct first-year applicants using the platform at returning member institutions. It does not measure all Chinese applicants or the number who were admitted, obtained visas, deposited or enrolled.
The next question is conversion
A smaller enrolled base and a positive application-stage signal can coexist. The practical test is whether the 2024/25 increase is followed by stronger offers, deposits, arrivals and enrollment within institutions' own China pipelines.
Implications for Institutions
- Use current undergraduate baselines. Pre-2020 China volumes should not be carried forward directly into present enrollment targets.
- Track applicants, offers, deposits, visa documents, arrivals and enrolled students separately. The Common App increase belongs at the first of those stages.
- Compare national direction with the institution's own program data. If applications rise while deposits or arrivals remain flat, the constraint lies after initial demand.
- Keep U.S. and Canadian measures distinct. Open Doors persons, Statistics Canada program enrolments, study permits and SEVIS records answer different questions.
- Review undergraduate recruitment at program level. National change does not identify which fields, price points or institutions retained demand.
North American undergraduate mobility from China is operating from a smaller enrolled base than it was around 2019/20. The recent Common App result makes the current picture more nuanced than a continuous decline, but enrollment recovery will require evidence from later stages of the cycle.
Custom Research for Institutions
Universities and education organizations seeking tailored research on Chinese student mobility, North American admissions or specific market questions may contact us at contact@howdygroup.net to discuss the research scope.
Research scope and deliverablesSources
Primary sources
- IIE Open Doors: Academic Level and Places of Origin
- Statistics Canada: Postsecondary enrolments by student characteristics, table 37-10-0184-01
- Common App: End-of-season report, 2024/25
- ICE/SEVP: 2019 SEVIS by the Numbers
- ICE/SEVP: 2024 SEVIS by the Numbers
Related Howdy analysis
Data last reviewed: August 27, 2026. This article uses the latest complete source periods included in the current Howdy evidence panel: Open Doors through 2024/25, Statistics Canada through 2023/24, Common App through the 2024/25 application season and SEVIS through calendar year 2024.