
Key Takeaways
- Open Doors reported 120,229 China-origin graduate students in the United States in 2024/25, 12.3% fewer than in 2019/20.
- Statistics Canada recorded 10,236 master's or equivalent program enrolments among international students with Chinese citizenship in 2023/24, 5.7% above 2019/20.
- Canadian doctoral or equivalent enrolments rose from 3,477 to 4,140 over the same period, an increase of 19.1%.
- Graduate-level weight increased in both systems for different reasons: U.S. graduate numbers fell less sharply than undergraduate numbers, while Canadian master's and doctoral enrolments increased in absolute terms.
Measurement Before Comparison
There is no harmonized North American graduate-student series. This analysis compares changes within each official source and does not combine the underlying counts.
Open Doors reports China-origin graduate students at U.S. higher education institutions across an academic year. Its graduate category does not separate master's and doctoral students. Statistics Canada distinguishes master's and doctoral levels, but reports fall-snapshot program enrolments among international students with Chinese citizenship. Those counts are randomly rounded to a multiple of three and do not represent unique persons.
| Indicator | Population and unit | Period | Change used here |
|---|---|---|---|
| United States graduate | China-origin graduate students reported in Open Doors | 2019/20 to 2024/25 | 137,096 to 120,229 (−12.3%) |
| Canada master's or equivalent | Fall-snapshot program enrolments among international students with Chinese citizenship | 2019/20 to 2023/24 | 9,681 to 10,236 (+5.7%) |
| Canada doctoral or equivalent | Fall-snapshot program enrolments among international students with Chinese citizenship | 2019/20 to 2023/24 | 3,477 to 4,140 (+19.1%) |
Method note: all percentage changes are calculated within one source and one statistical definition. The indexed chart sets each series to 100 in 2019/20 to compare direction and relative change; it does not convert the series into a shared population.
U.S. Graduate Enrollment Remained Below 2019/20
The U.S. graduate population partially recovered, then declined again
Swipe horizontally to view the full chart
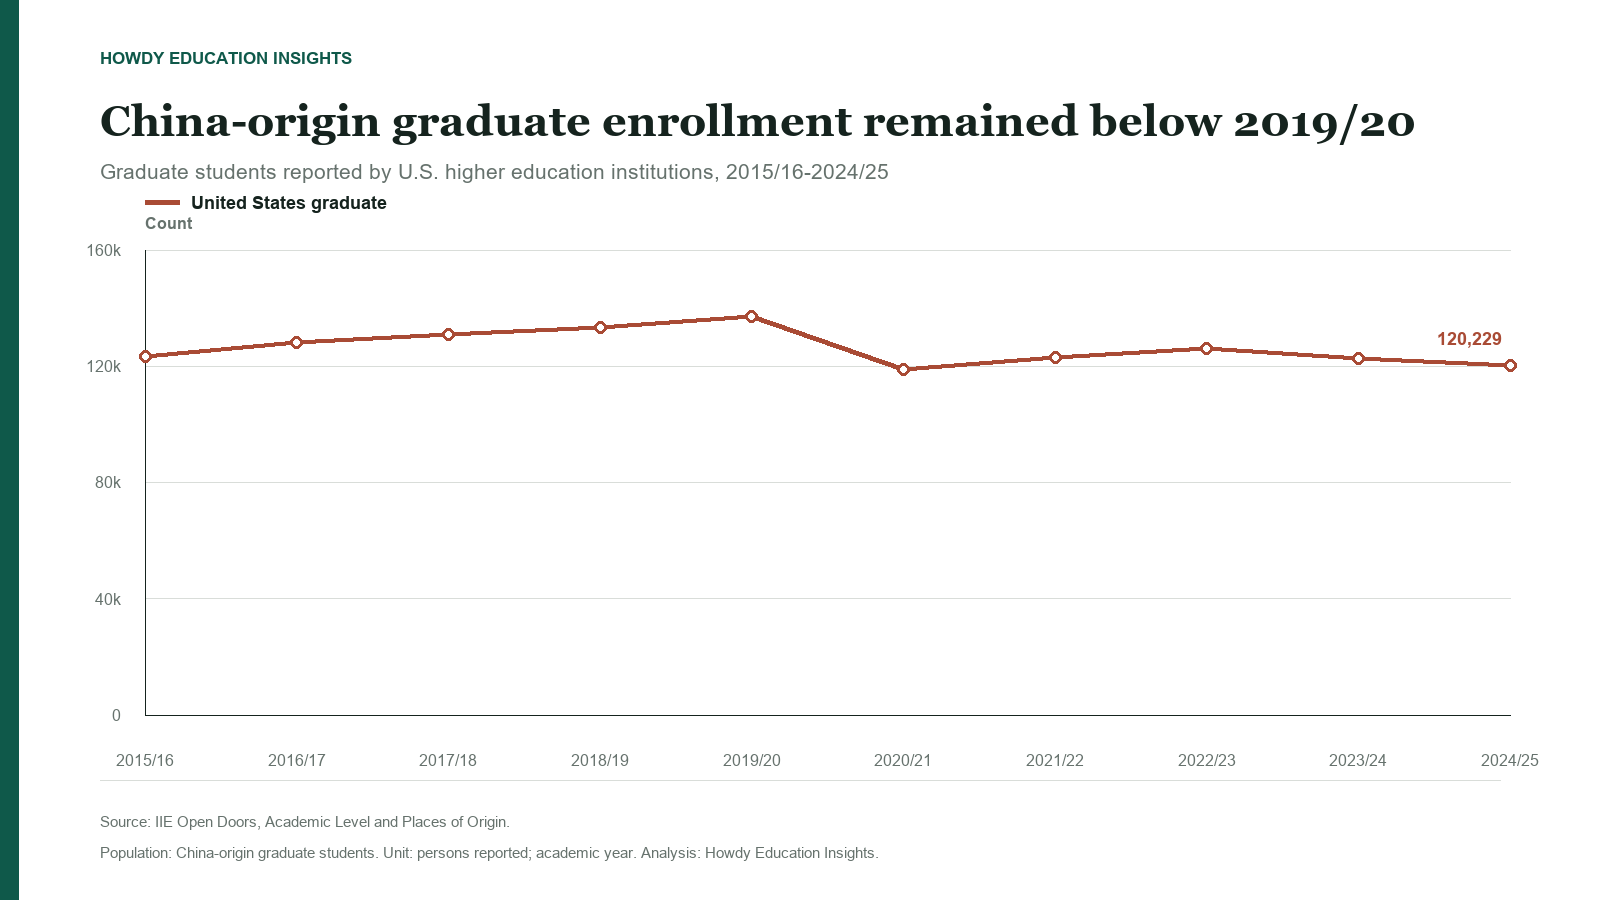
Open Doors reported steady growth in the China-origin graduate population from 123,250 in 2015/16 to 137,096 in 2019/20. The count then fell to 118,859 in 2020/21.
A partial recovery brought the total to 126,028 in 2022/23, followed by declines in the next two academic years. The 2024/25 count of 120,229 was 12.3% below 2019/20 and 4.6% below the recent 2022/23 high.
Graduate enrollment nevertheless became a larger part of the China-origin Open Doors total. Its share rose from 36.8% in 2019/20 to 45.2% in 2024/25 because graduate numbers contracted much less sharply than undergraduate numbers. The higher share does not represent absolute graduate growth.
Canadian Master's and Doctoral Enrolments Increased
Canada recorded net growth at both graduate levels
Swipe horizontally to view the full chart
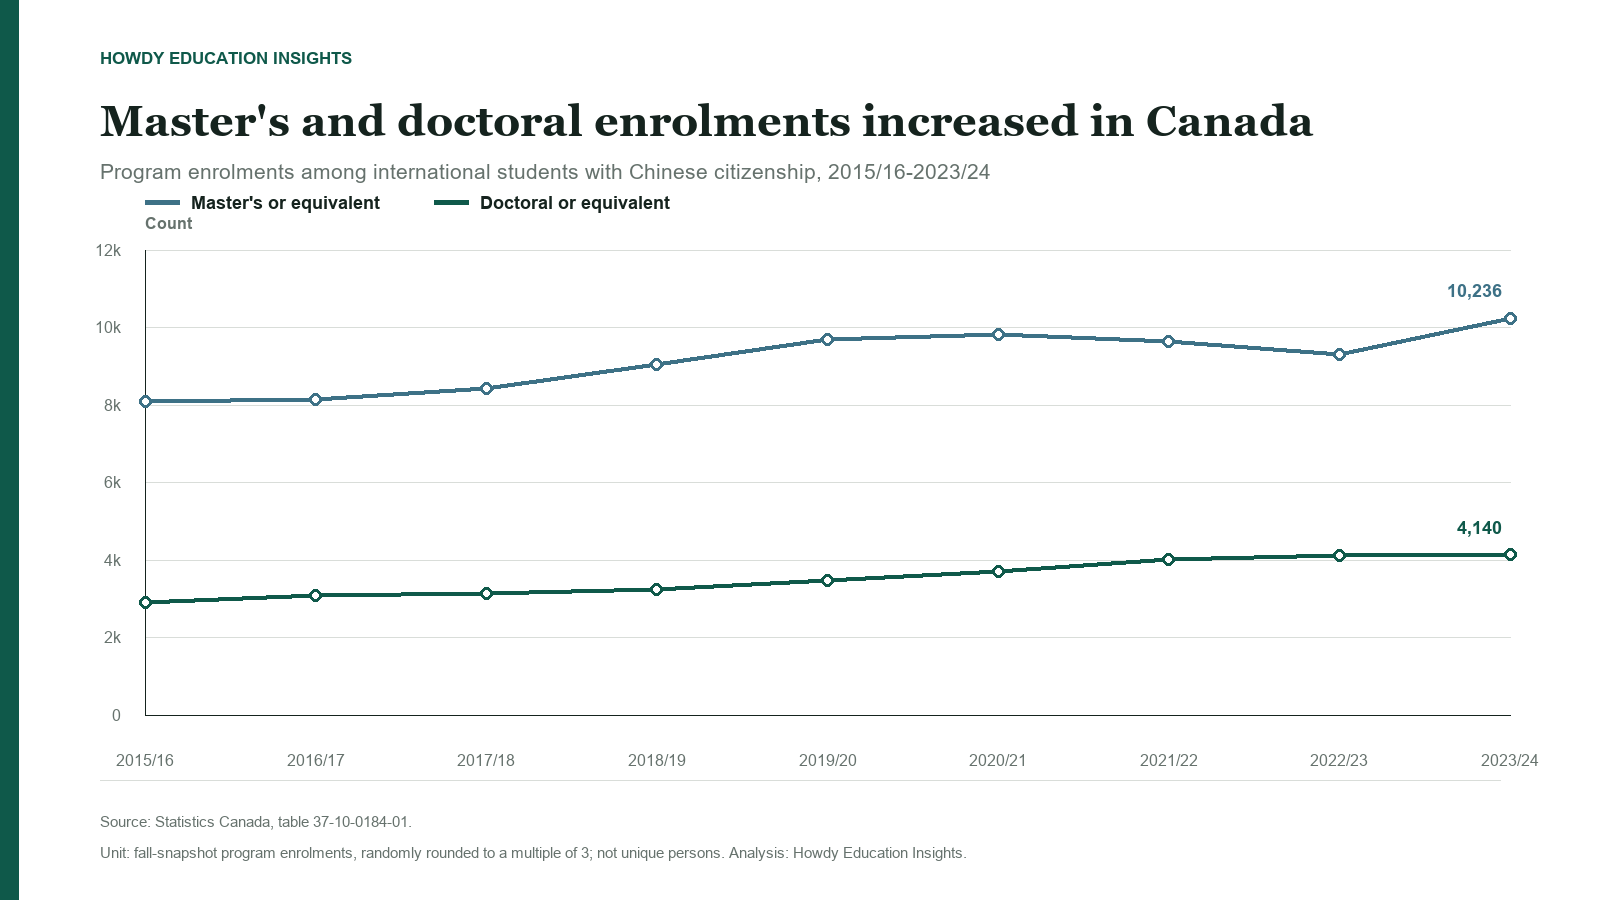
Master's or equivalent enrolments did not rise continuously. They increased from 9,681 in 2019/20 to 9,828 in 2020/21, declined to 9,300 in 2022/23, and then reached 10,236 in 2023/24. The net increase from 2019/20 was 5.7%.
Doctoral or equivalent enrolments followed a steadier upward path, rising from 3,477 in 2019/20 to 4,140 in 2023/24, an increase of 19.1%. Combined master's and doctoral enrolments grew 9.3%, from 13,158 to 14,376.
Their combined share of Chinese-citizenship postsecondary program enrolments increased from 14.6% to 21.6%. Unlike the U.S. result, this change included absolute growth at both graduate levels as the broader China-citizenship postsecondary total declined.
Graduate-Level Paths Diverged
The common 2019/20 baseline reveals different paths
Swipe horizontally to view the full chart
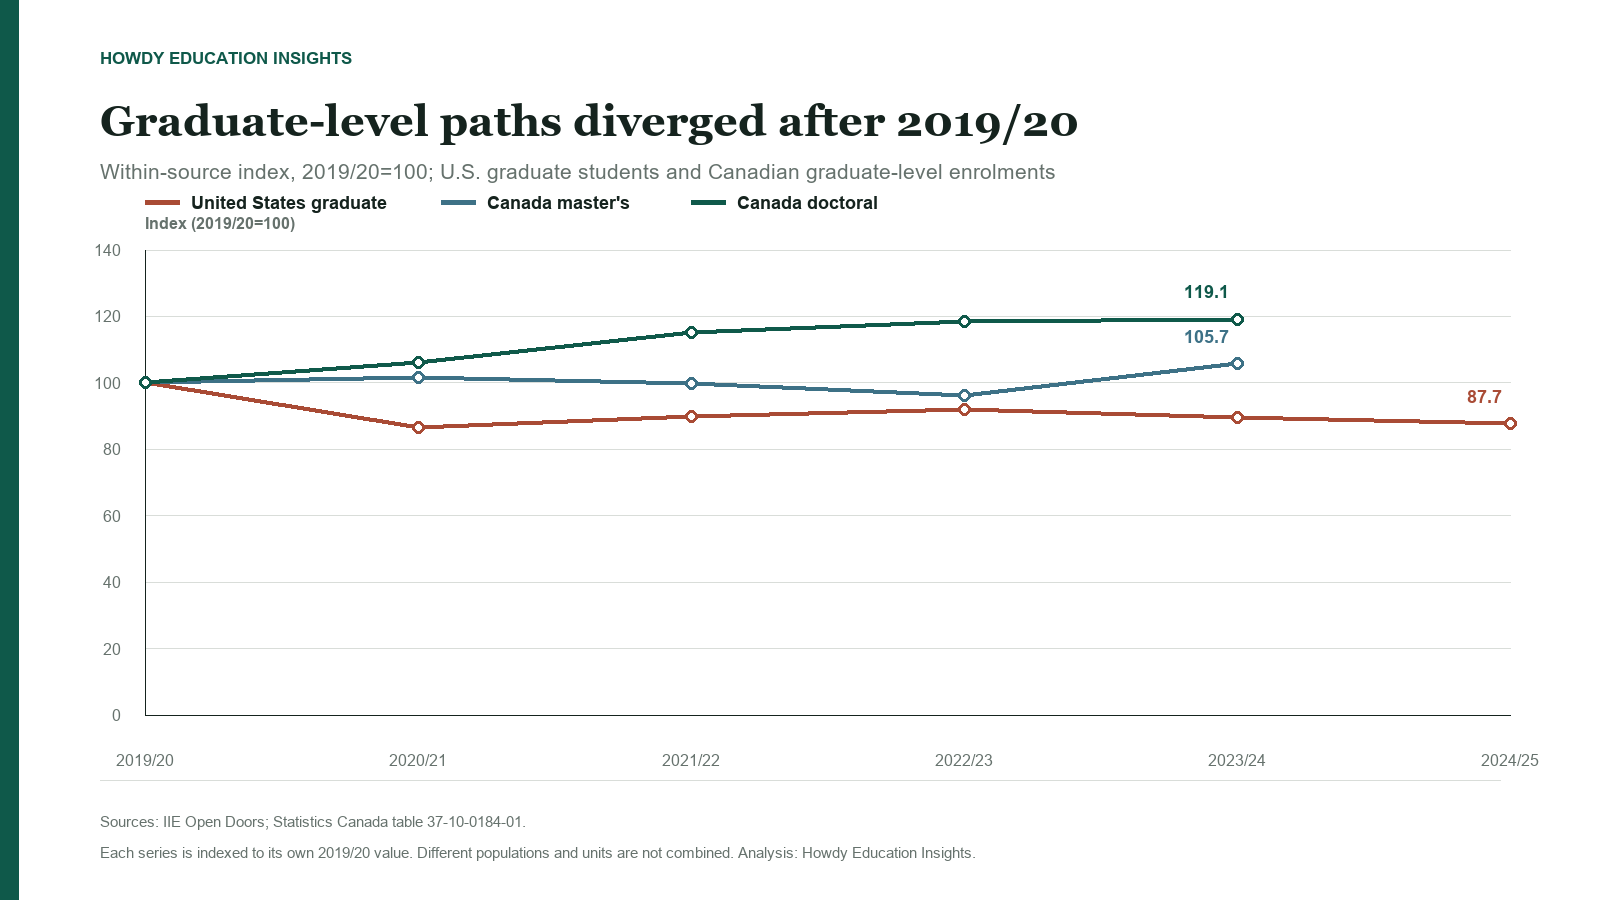
At the latest shared endpoint of 2023/24, the U.S. graduate index stood at 89.6, compared with 105.7 for Canadian master's enrolments and 119.1 for Canadian doctoral enrolments. The U.S. series then declined further to 87.7 in 2024/25; no 2024/25 Canadian observation is available in the Statistics Canada series used here.
At the national level, the measured U.S. graduate population remained below its 2019/20 level, while Canadian master's and doctoral program enrolments were above theirs. The data do not show that students moved directly from one country to the other.
What the Data Do Not Resolve
U.S. master's and doctoral paths cannot be separated here
Open Doors combines graduate students in one category. This dataset cannot show whether U.S. master's and doctoral populations followed the same trajectory.
National level data do not identify program demand
The series are not cross-tabulated here by graduate level, field, institution, price or program length. National growth or decline cannot be assigned to a specific program without institution-level evidence.
Direction is not an explanation
Neither source measures student motivation or destination preference. Explaining the divergence requires separate evidence.
Implications for Institutions
- Plan graduate recruitment separately from undergraduate recruitment. The U.S. graduate population remained much more resilient than the undergraduate population after 2019/20.
- In Canada, distinguish master's and doctoral planning. Both were above 2019/20 in the latest Statistics Canada data, but their trajectories and scale differed.
- Compare national trends with program-level inquiries, applications, offers, deposits and arrivals. National counts cannot identify where graduate demand persisted.
- Keep the source definitions intact. Open Doors students and Statistics Canada program enrolments should not be added into a North American total or treated as direct substitutes.
Graduate study became more prominent within the China-origin student mix in both countries, but the underlying paths were different. For institutions, that makes degree-level and program-level evidence more useful than a single North American growth assumption.
Custom Research for Institutions
Universities and education organizations seeking tailored research on Chinese student mobility, North American admissions or specific market questions may contact us at contact@howdygroup.net to discuss the research scope.
Research scope and deliverablesSources
Primary sources
- IIE Open Doors: Academic Level and Places of Origin
- Statistics Canada: Postsecondary enrolments by student characteristics, table 37-10-0184-01
- Statistics Canada: Canadian postsecondary enrolments and graduates, 2023/2024
Related Howdy analysis
Data last reviewed: August 27, 2026. This article uses the latest complete source periods in the current Howdy evidence panel: Open Doors through 2024/25 and Statistics Canada through 2023/24.