
Key Takeaways
- The IRCC effective-year measure fell from 84,140 China-citizen study permit holders in 2019 to 48,755 in 2025, a decline of 42.1%.
- The separate year-end stock fell from 140,530 valid permit holders in 2019 to 99,650 in 2024, a decline of 29.1%. It remained close to 100,000 from 2022 through 2024.
- Statistics Canada recorded 66,606 China-citizen international postsecondary program enrolments in the 2023/24 fall snapshot, 26.3% below 2019/20.
- Bachelor's enrolments fell 28.2% between 2019/20 and 2023/24, while master's enrolments rose 5.7% and doctoral enrolments rose 19.1%.
- STEM enrolments fell 19.9% and BHASE enrolments fell 30.0%. STEM's share therefore rose from 37.4% to 40.6%, but that compositional gain was not absolute STEM growth.
- The sources support broad weakening with strong segment divergence. They do not form one market total, establish destination substitution or identify one cause.
Data Snapshot
This analysis uses three measures from two Tier 1 Canadian sources. IRCC's effective-year table records unique people whose study permit or permits became effective during a calendar year. Its year-end table records unique people holding a valid study permit on December 31. Statistics Canada reports international postsecondary program enrolments at an institution-selected fall snapshot date.
The measures differ in population, timing and latest available period. IRCC effective-year data are used through 2025, the comparable year-end citizenship table through 2024, and Statistics Canada enrolment data through 2023/24. Comparisons and percentage changes are calculated only within one definition.
| Measure | Pre-pandemic baseline | Latest used | Within-series change |
|---|---|---|---|
| IRCC permit(s) effective during year | 84,140 in 2019 | 48,755 in 2025 | −42.1% |
| IRCC valid permit on December 31 | 140,530 in 2019 | 99,650 in 2024 | −29.1% |
| Statistics Canada fall-snapshot program enrolments | 90,384 in 2019/20 | 66,606 in 2023/24 | −26.3% |
Method note: IRCC suppresses values from 0 to 5, rounds other values to the nearest 5 and labels the data preliminary. Statistics Canada randomly rounds counts to a multiple of 3. Its enrolments are program counts at a fall snapshot, not unique people or a full academic-year total; a person enrolled in more than one program can be counted more than once. The three measures must not be added or treated as one cohort.
Charts
Effective-year permit activity fell 42.1% from 2019 to 2025
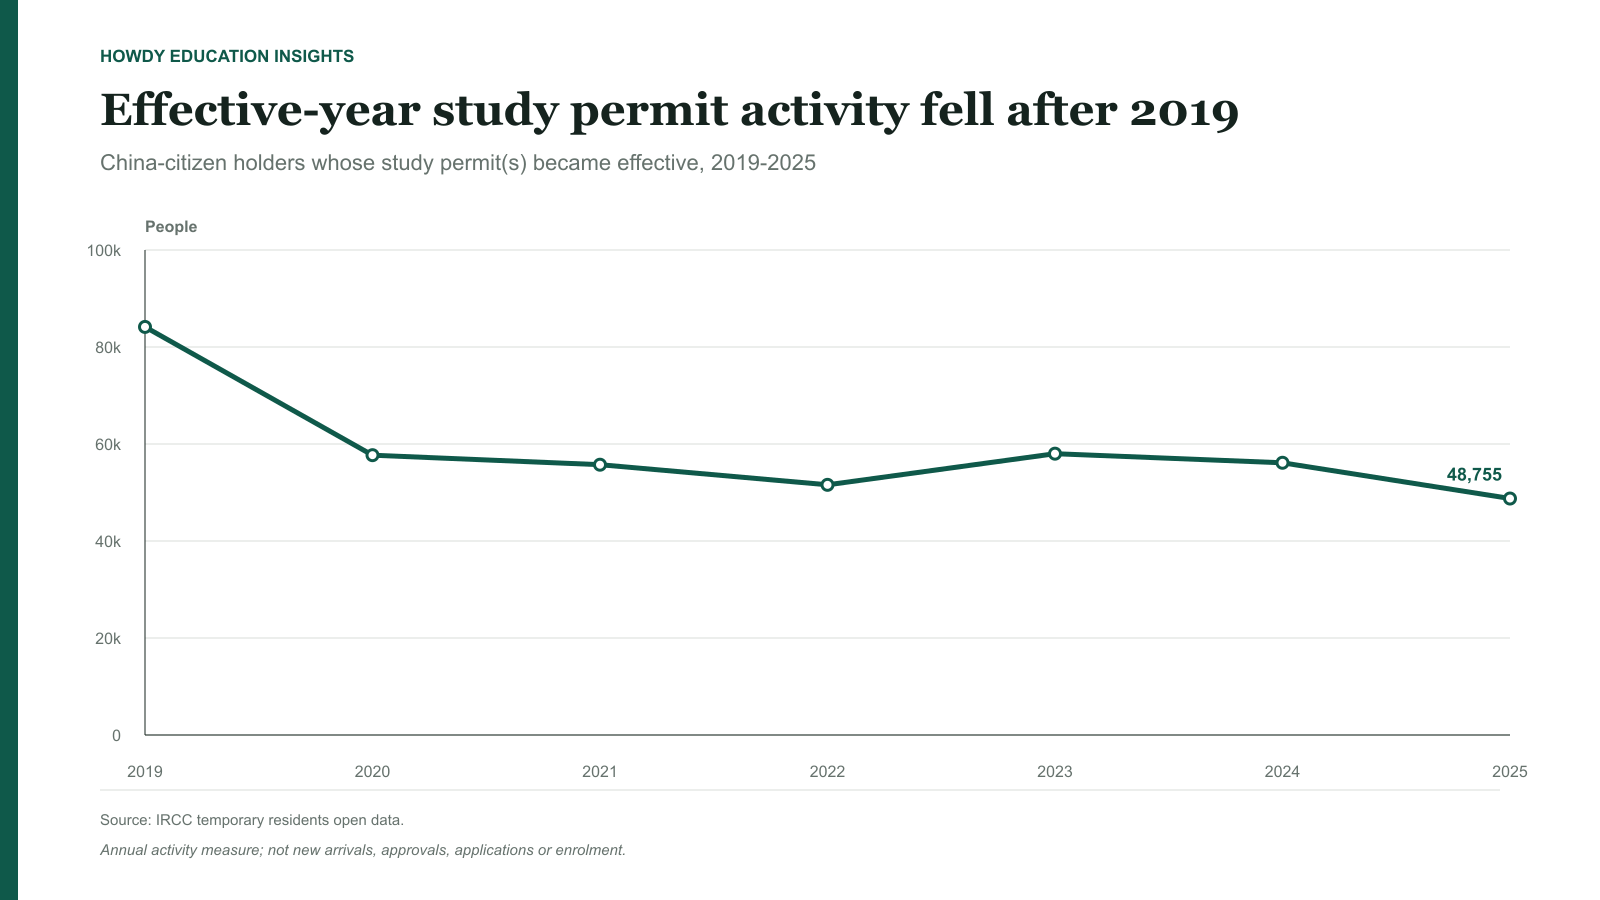
The effective-year count fell sharply in 2020 and continued down to 51,580 in 2022. It rose 12.5% to 58,005 in 2023, then fell to 56,130 in 2024 and 48,755 in 2025. The later decline means the 2023 increase should not be described as a sustained recovery.
This measure includes unique people whose permit or permits became effective during the year, including activity involving people already in Canada. It is not a count of first-time approvals, new arrivals, applications or students who enrolled.
The year-end permit stock remained near 100,000 after 2022
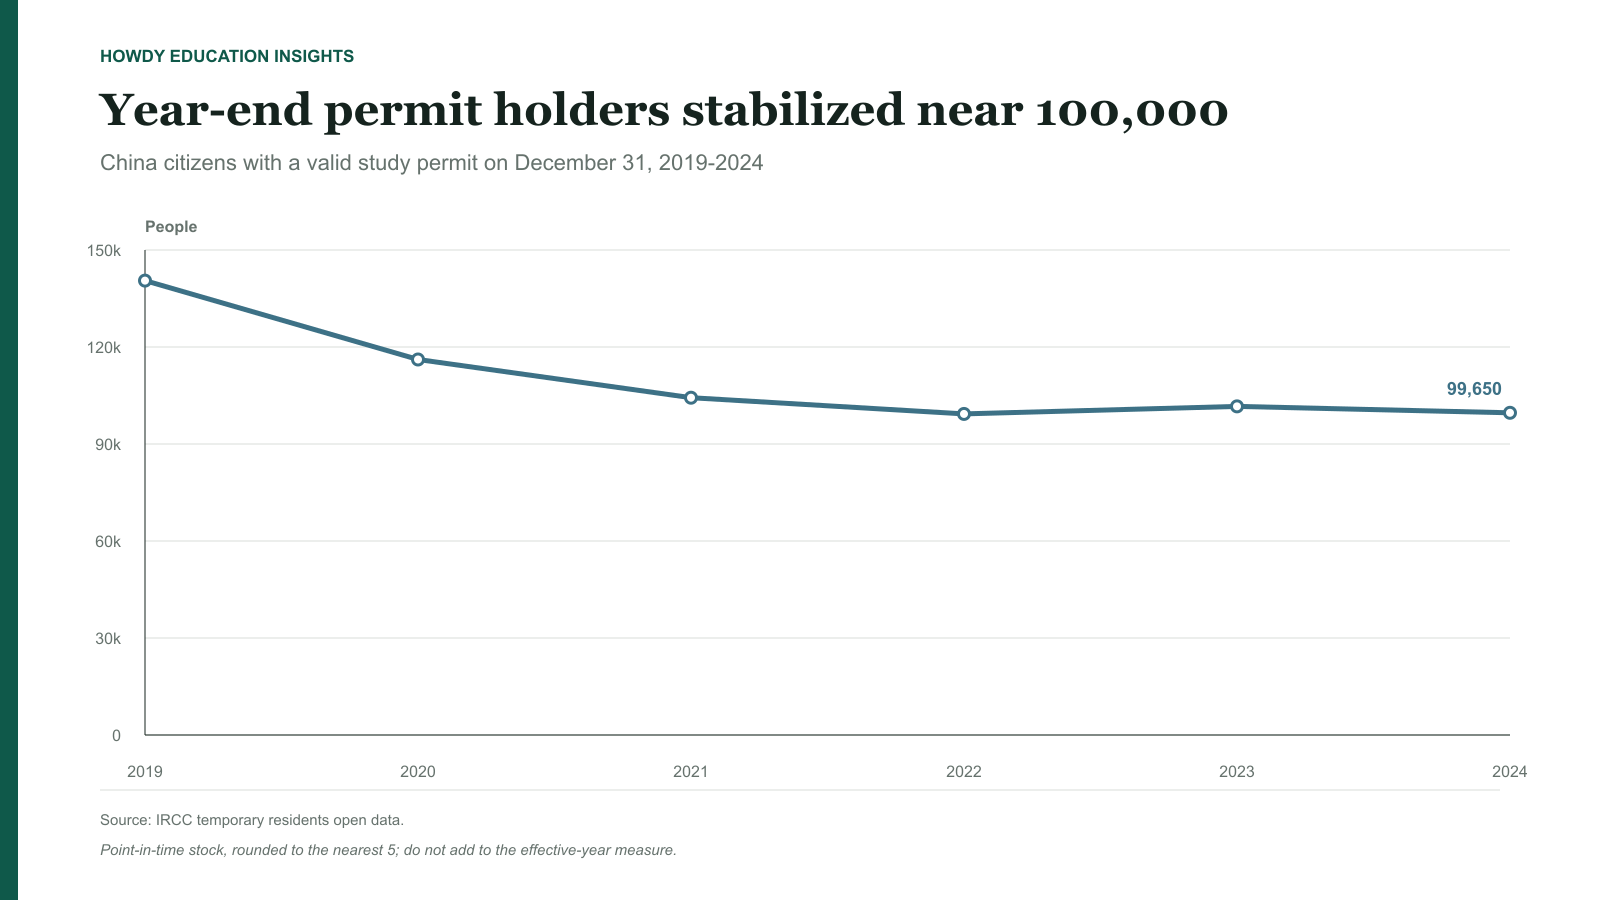
The year-end stock fell from 140,530 in 2019 to 99,300 in 2022, rose to 101,640 in 2023 and slipped to 99,650 in 2024. This later pattern is closer to low-level stability than to a return toward the pre-pandemic baseline.
A stable year-end stock can coexist with weaker annual permit activity because the stock includes continuing permit holders. It does not identify how many people were new to Canada or enrolled at a postsecondary institution.
The postsecondary decline was concentrated at the bachelor's level
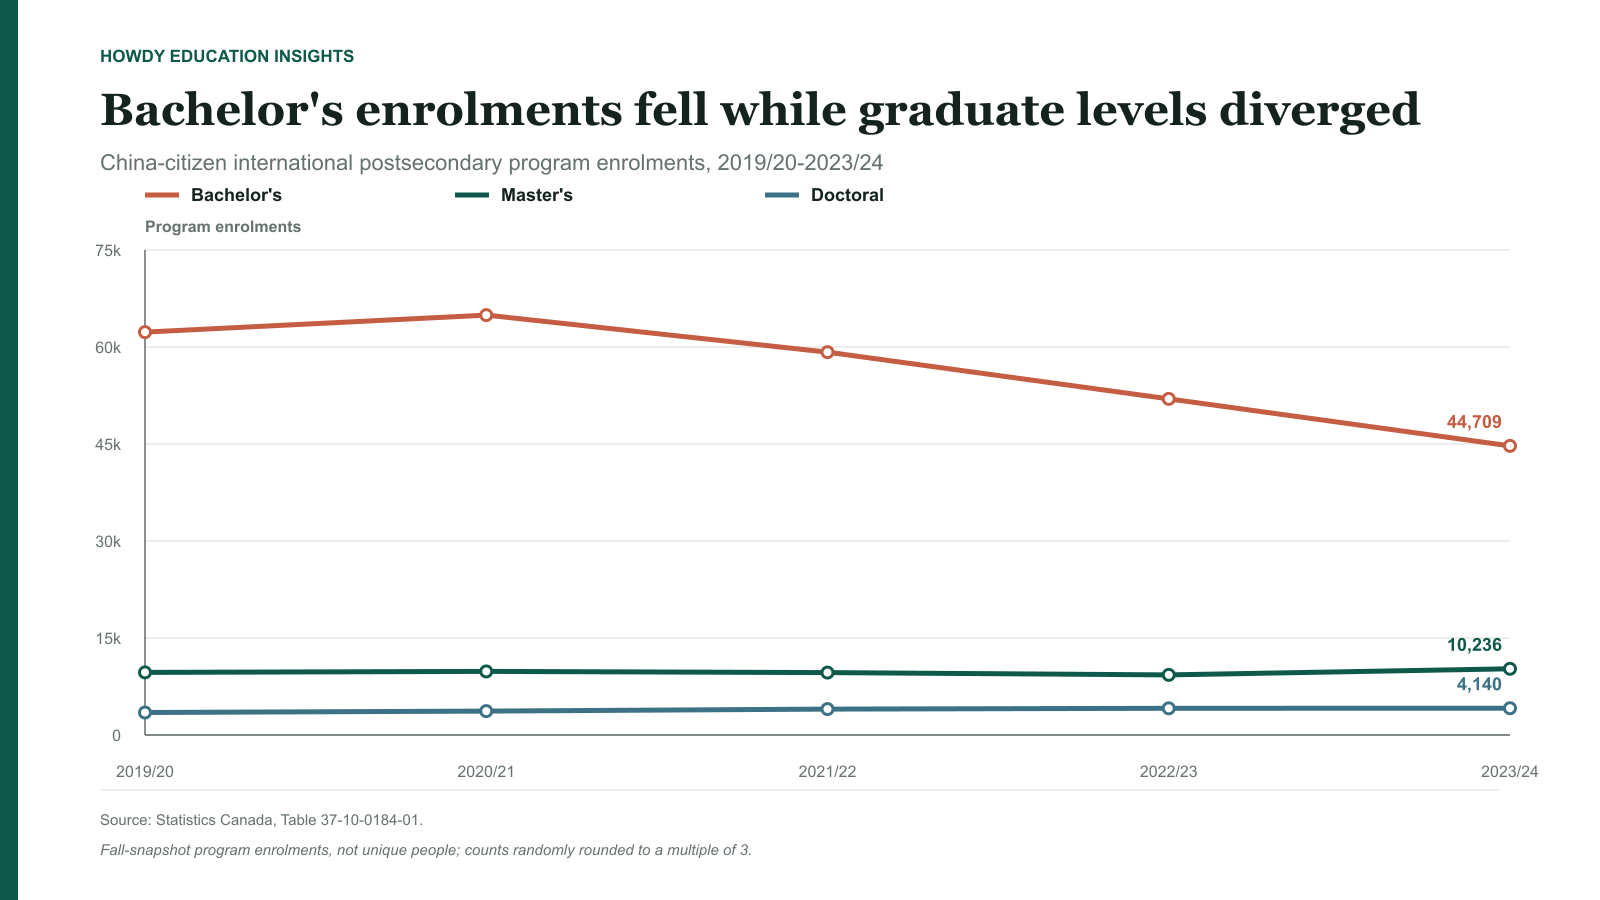
Total China-citizen international postsecondary program enrolments fell from 90,384 in 2019/20 to 66,606 in 2023/24. Bachelor's enrolments fell from 62,298 to 44,709, or 28.2%, and remained the largest level despite the decline.
Master's enrolments rose from 9,681 to 10,236, or 5.7%, while doctoral enrolments rose from 3,477 to 4,140, or 19.1%. These gains occurred from much smaller bases and should not be used to describe all graduate programs or institutions as growing.
Field composition changed because categories declined at different rates
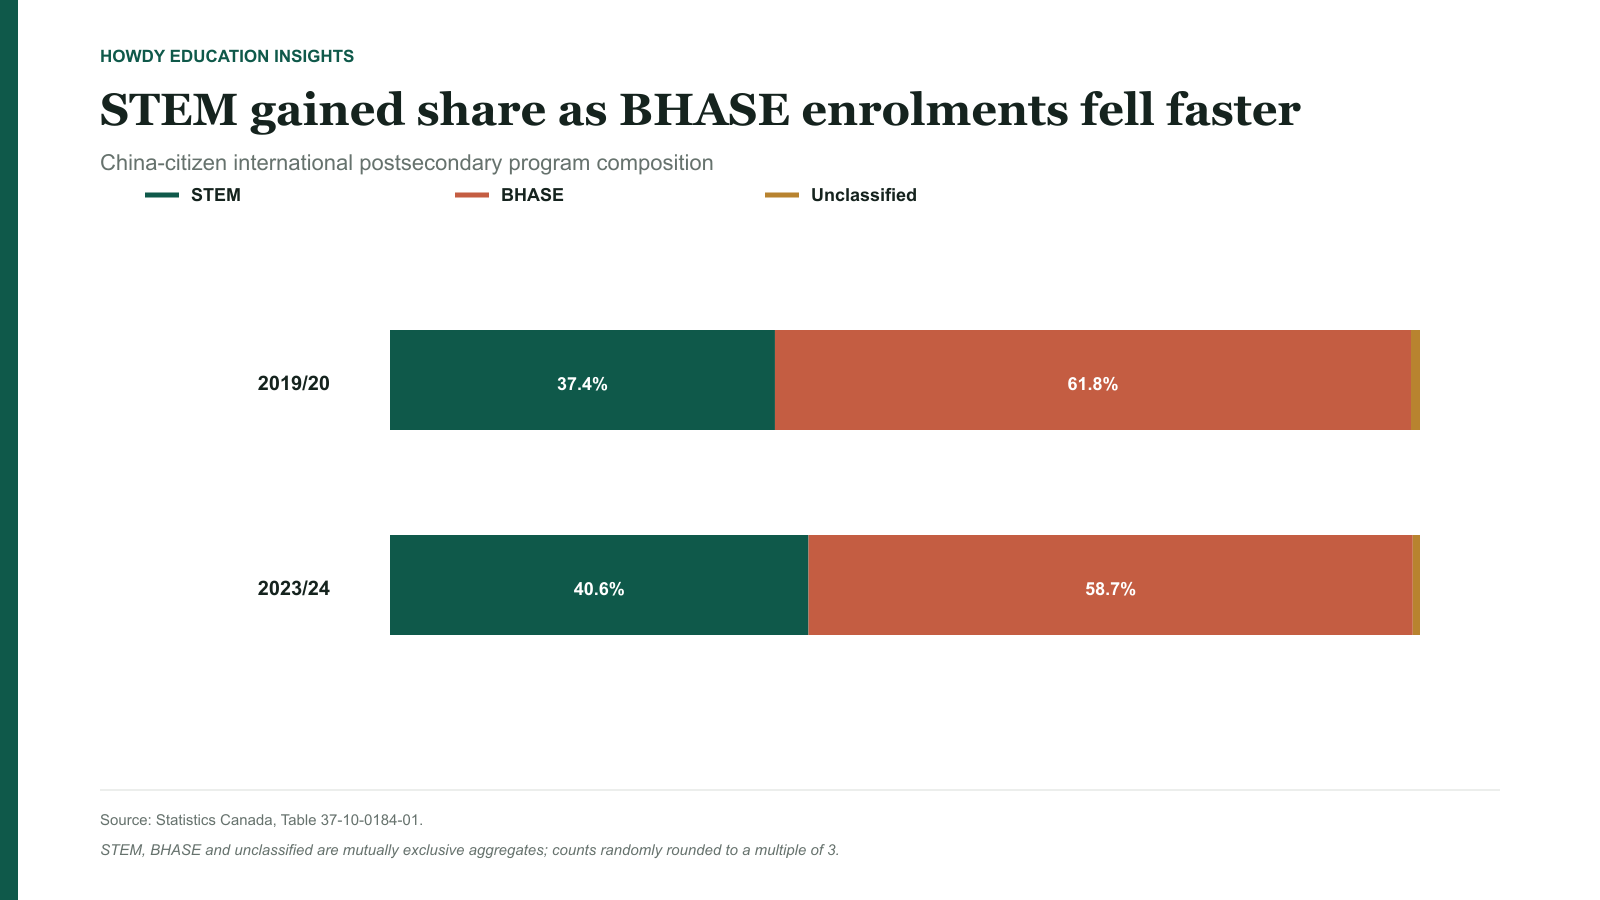
STEM enrolments fell from 33,780 to 27,063, or 19.9%. BHASE enrolments fell from 55,815 to 39,075, or 30.0%. Because BHASE declined faster, STEM's share of the total rose by 3.2 percentage points even though the STEM count also fell.
Within the published subcategories, business and administration fell 37.3%, engineering and engineering technology fell 30.5%, and mathematics and computer and information sciences fell 13.7%. These subcategories sit inside the broader aggregates and must not be added to STEM or BHASE totals.
What Changed
All three measures weakened, but not over the same period or by the same amount
The effective-year permit measure shows the largest decline, the year-end stock a smaller decline and the fall-snapshot enrolment series a separate postsecondary contraction. Their common direction strengthens the conclusion that the China-origin market was below its pre-pandemic baseline, but the magnitudes are not interchangeable.
The postsecondary market became more graduate-weighted
Bachelor's program enrolments accounted for most of the absolute decline in the Statistics Canada level series. Master's and doctoral categories moved differently, which means a national China total is a weak planning benchmark for institutions with different credential mixes.
A larger share can result from a smaller decline
STEM gained share because it fell less sharply than BHASE. The same reasoning applies to degree levels: relative weight can rise without broad expansion. Recruitment teams should always pair a share with its underlying count.
Why It Matters
‘Is the China market recovering in Canada?’ is too broad to answer operationally. The relevant question is which China-citizen segment is changing for a particular credential, field, institution type, price point and post-graduation pathway.
The 2024 international student cap and subsequent allocations affect recent recruitment conditions, but they cannot by themselves explain changes already visible after the 2019 baseline. The administrative and enrolment tables do not measure family affordability, destination preference, perceived safety, employment expectations or policy sentiment, so no single-cause claim is warranted.
Publication lags also matter. The latest annual permit-activity signal reaches 2025, while the latest comparable postsecondary enrolment structure is 2023/24. A current recruitment decision should not treat the older enrolment mix as a real-time measure of the newest intake.
What the Data Does Not Tell Applicants
These national series do not predict admission, study permit or employment outcomes for an individual applicant. They do not measure program capacity, applicant concentration, institutional selectivity, funding or current permit approval conditions.
Applicants still need current program-level evidence on requirements, total cost, academic fit, funding, graduate outcomes and post-study eligibility, together with current official immigration guidance. National movement provides context, not a personal forecast.
Implications for Institutions
- Separate inquiry, application, offer, deposit, permit and enrolment measures. IRCC permit activity and Statistics Canada program enrolments describe different stages and should not substitute for an institution's own conversion funnel.
- Plan by credential level. Bachelor's recruitment faces a different national baseline from master's and doctoral recruitment, and broad China targets should be replaced with program-level assumptions.
- Pair composition with absolute counts. A higher STEM or graduate share is not evidence of growth unless the underlying count also increased.
- Make program value legible. In a smaller and more selective market, total cost, duration, work-integrated learning, student support and credible outcomes need to be explained at program level.
- Use a post-2020 baseline and update it by source cadence. Permit data can provide a more recent administrative signal, while delayed enrolment data are better suited to structural analysis than real-time forecasting.
The evidence does not support abandoning China or assuming an automatic return to the 2019 scale. It supports a narrower, program-specific recruitment strategy built around credential mix, price, policy exposure, student support and verified outcomes.
Sources
Primary sources
- IRCC: Temporary Residents, Study Permit Holders Open Data
- IRCC: Study permit holders by citizenship and year permit(s) became effective
- IRCC: Study permit holders by citizenship with a valid permit on December 31
- Statistics Canada Table 37-10-0184-01: Postsecondary enrolments by citizenship, level and field
- Statistics Canada: Canadian postsecondary enrolments and graduates, 2023/2024
- IRCC: 2025 allocations under the international student cap
Related Howdy analysis
Data last reviewed: 25 August 2026. The latest comparable observations used are IRCC effective-year 2025, IRCC year-end 2024 and Statistics Canada 2023/24. Later partial-year permit data were not annualized, and no permit measure was combined with enrolment counts.