
Key Takeaways
- Open Doors undergraduate numbers fell 47.0% between 2019/20 and 2024/25, compared with a 12.3% decline among graduate students.
- F-1 visas issued to China-mainland nationals were 21.9% below FY2019 in FY2024, even after increasing 33.5% from FY2022 to FY2024.
- Active F/M SEVIS records for China citizens were 30.5% below CY2019 in CY2024, but increased only 1.6% between CY2022 and CY2024.
- Chinese K-12 SEVIS records were 65.5% below CY2018 in CY2024. The modest increase after CY2022 did not restore the earlier scale.
- Taken together, the sources support divergence by student segment and statistical measure. They do not support a single recovery rate, a single cause or a combined market-size index.
Data Snapshot
This analysis uses three official or government-sponsored statistical systems. Open Doors describes students reported by U.S. higher education institutions across an academic year. Department of State data record visa issuances during a federal fiscal year. SEVIS reports active F/M administrative records during a calendar year.
The three periods overlap only partly. Placing the results side by side can identify whether signals move in similar or different directions, but it cannot turn them into a common cohort or a single market total.
| Source | Period | Population and unit | Latest observation used |
|---|---|---|---|
| IIE Open Doors | Academic year | China-origin higher education students and OPT category | 265,919 in 2024/25 |
| Department of State | Fiscal year | F-1 visa issuances to China-mainland nationals | 82,654 in FY2024 |
| ICE/SEVP SEVIS | Calendar year | Active F/M records associated with China citizens | 329,541 in CY2024 |
| ICE/SEVP K-12 | Calendar year | Active Chinese K-12 F/M records | 14,515 in CY2024 |
Method note: Open Doors temporarily included some students studying online from outside the United States during the pandemic period and later returned to its pre-pandemic definition. Department of State counting also changed with the FY2019 annual report. SEVIS records are not necessarily unique persons. All percentage changes in this article are calculated within one source and one statistical definition.
Charts
Undergraduate enrollment fell much faster than graduate enrollment
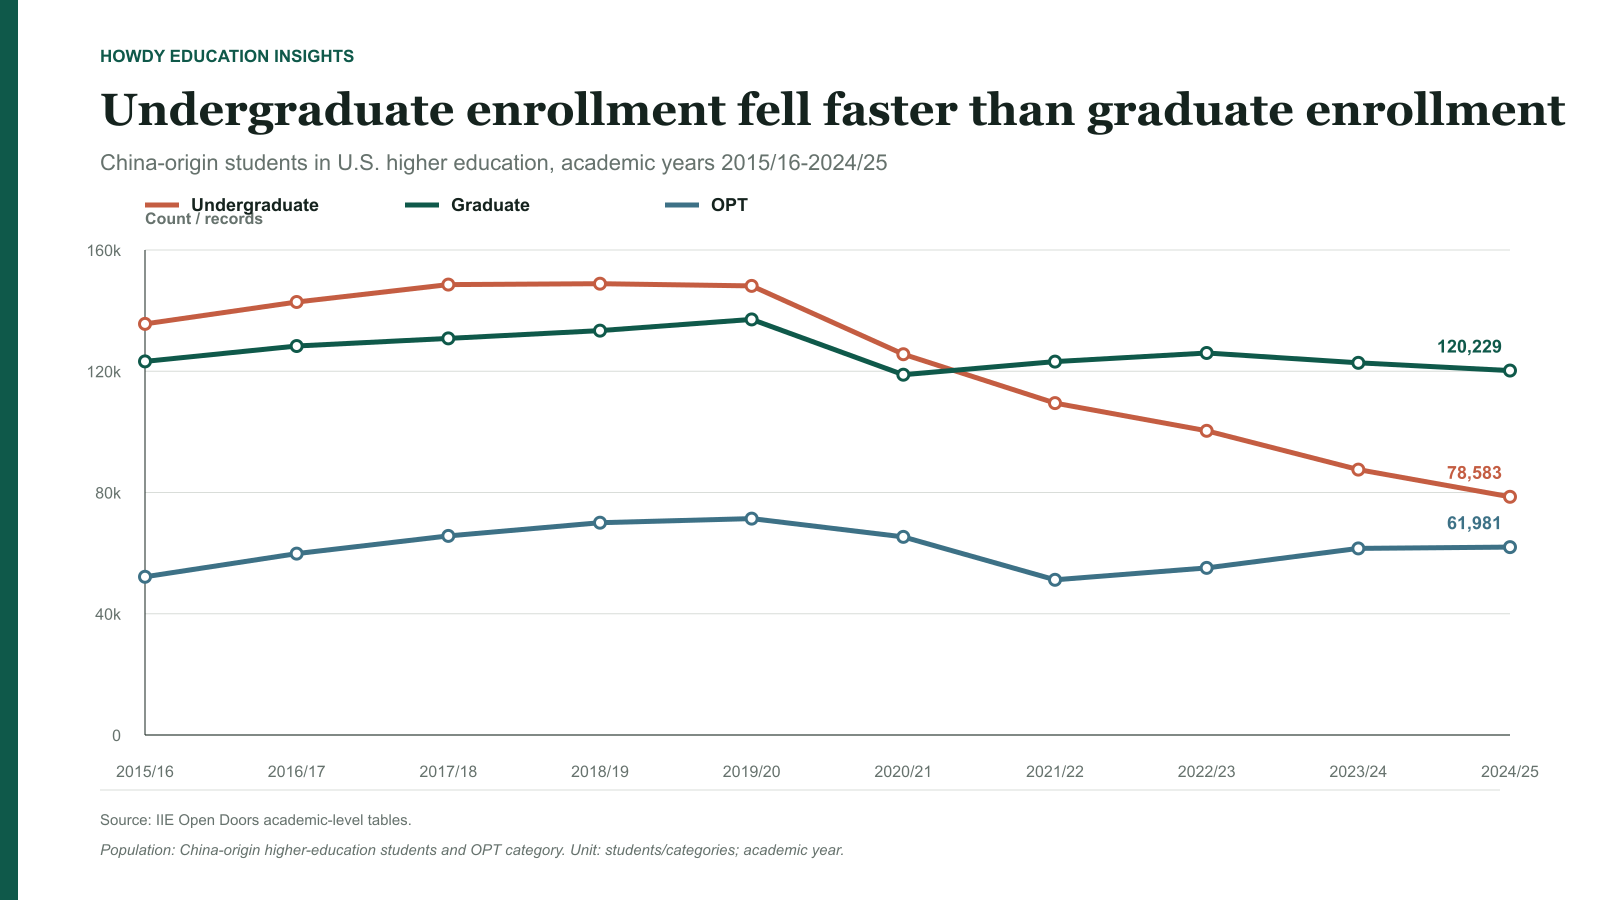
The total Chinese population reported by Open Doors fell from 372,532 in 2019/20 to 265,919 in 2024/25, a decline of 28.6%. Undergraduate numbers fell from 148,160 to 78,583, or 47.0%. Graduate numbers fell from 137,096 to 120,229, or 12.3%.
Graduate students therefore gained relative weight even though their absolute number did not return to its earlier level. OPT followed a different path: the latest count was 61,981, below the 71,380 reported in 2019/20 but above its 2021/22 low. A larger share is not the same as absolute growth.
F-1 issuance flows partially rebounded after FY2022
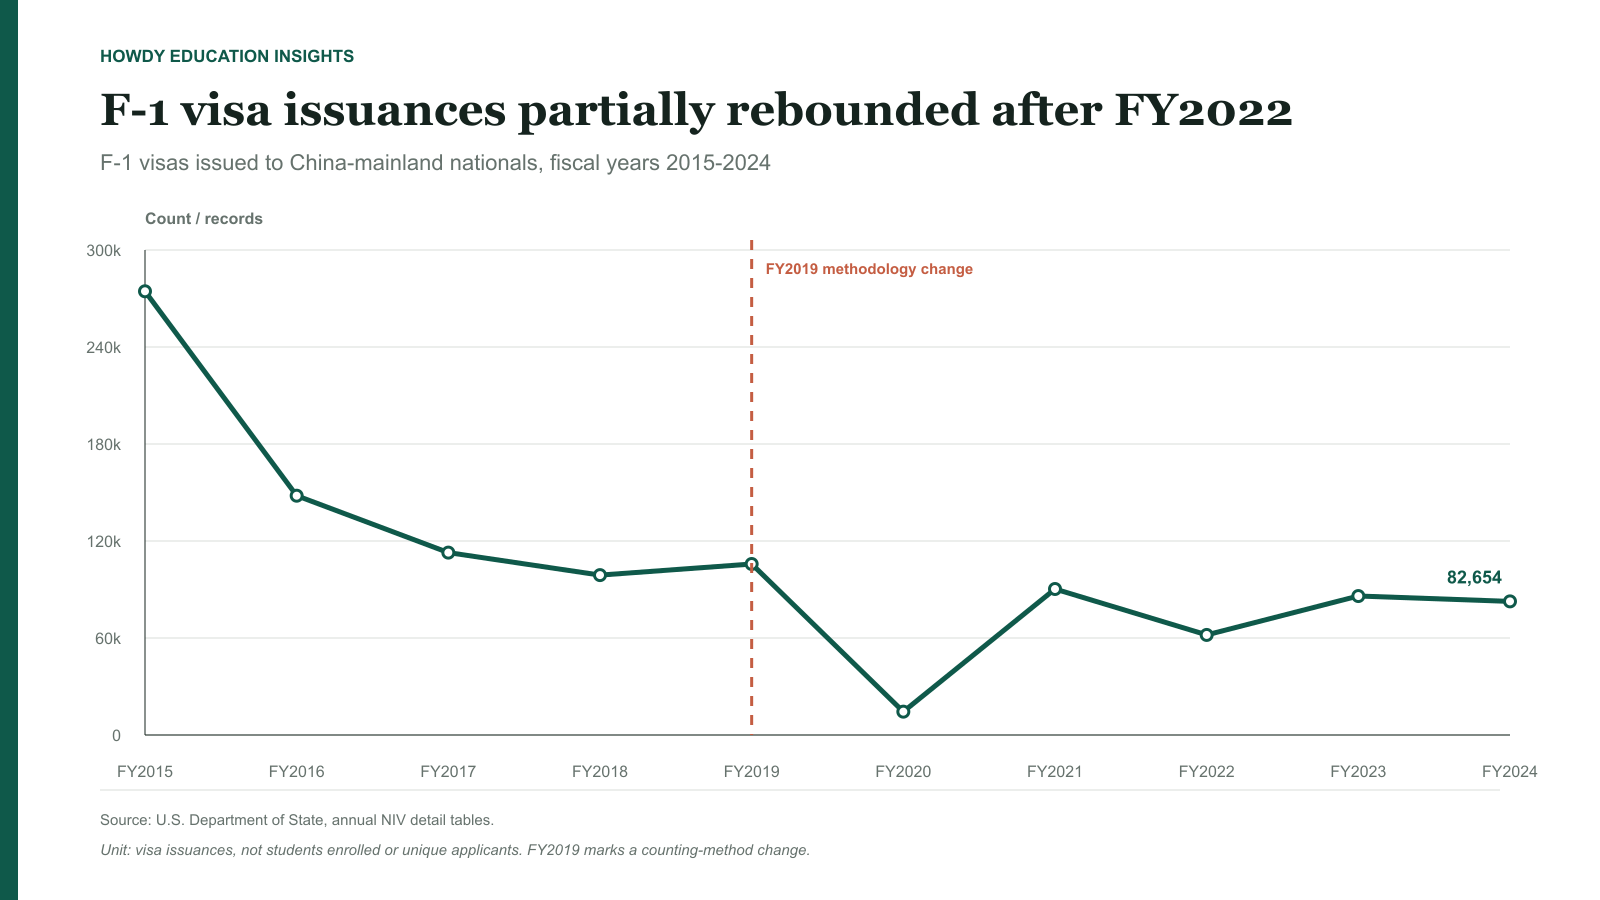
The Department of State issued 105,775 F-1 visas to China-mainland nationals in FY2019. The count was 61,894 in FY2022 and 82,654 in FY2024. The increase from FY2022 to FY2024 was 33.5%, but the FY2024 total remained 21.9% below FY2019.
This is best described as a partial within-series rebound. It is not proof that applications, arrivals or enrollment recovered by the same amount. A visa issuance is an administrative event, and some students can enroll using a visa issued in an earlier period.
Active F/M records were broadly stable after 2022
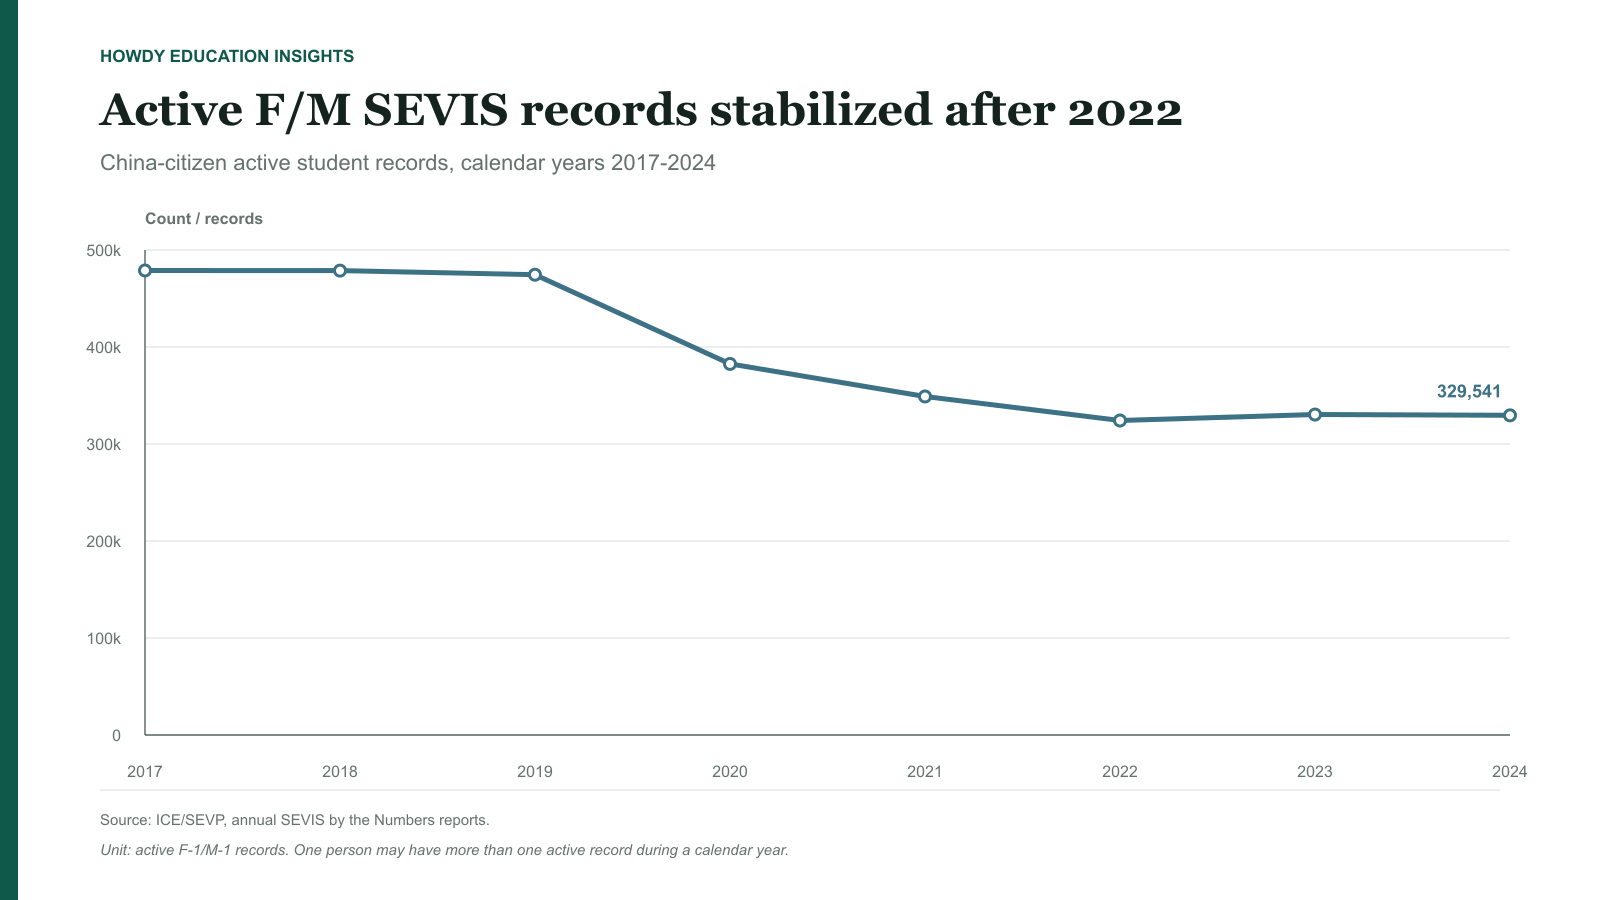
Active F/M SEVIS records associated with China citizens fell from 474,497 in CY2019 to 329,541 in CY2024, a decline of 30.5%. Yet the later period was comparatively flat: the count rose from 324,196 in CY2022 to 329,541 in CY2024, an increase of 1.6%.
That supports a narrow statement about stabilization in this administrative series. It does not establish that higher education enrollment, new-student demand or every education level stabilized at the same time.
The K-12 segment remained far below its earlier scale
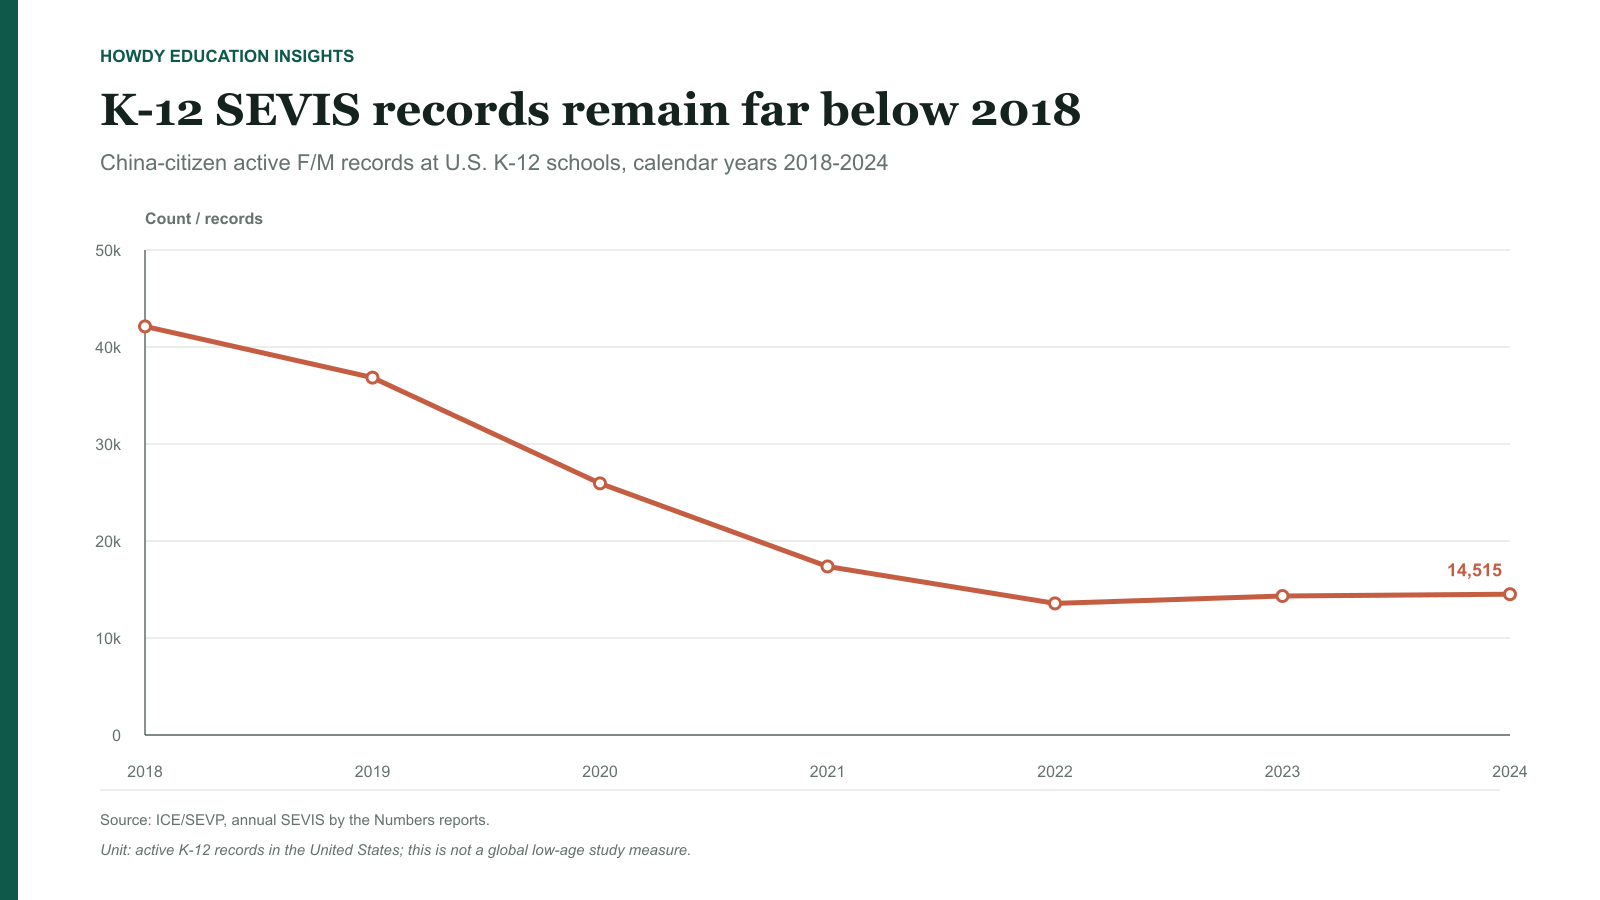
Chinese K-12 SEVIS records fell from 42,122 in CY2018 to 14,515 in CY2024, a decline of 65.5%. Records reached 13,565 in CY2022 and then increased 7.0% over the next two years. The direction changed, but the resulting population remained only about one third of its 2018 size.
K-12 should be treated as its own market. These records do not demonstrate that all high-income families withdrew, that low-age study disappeared or that a later undergraduate cohort will change by the same proportion.
What Changed
The higher education shift was concentrated at the undergraduate level
The Open Doors series shows that the post-2019/20 decline was not distributed evenly across academic levels. The undergraduate contraction was almost four times the graduate decline in percentage terms. By 2024/25, graduate students were the largest academic-level group among Chinese students in U.S. higher education.
An institution recruiting bachelor's students therefore faces a different market from one recruiting professional master's or doctoral students. A national China total conceals that difference.
The post-2022 direction depends on the measure
F-1 issuances rose materially between FY2022 and FY2024. Active F/M SEVIS records were nearly flat over CY2022-CY2024. Open Doors enrollment categories, however, did not all return to growth. These are not contradictory findings; they describe different stages, populations and time windows.
The evidence does not justify calling the whole market either recovered or still falling at one uniform rate. A more accurate account is partial rebound in one flow measure, near-stability in one administrative stock measure, and continued weakness in important enrollment segments.
Earlier-stage mobility remained the weakest segment
K-12 experienced the deepest measured contraction, and undergraduate enrollment fell more sharply than graduate enrollment. The administrative data do not establish a single household cause because they contain no national measure of family income, risk tolerance, destination preference or return-on-investment expectations.
Why It Matters
‘Is the China market declining?’ is too broad to guide recruitment. A usable institutional question is whether the relevant China-origin segment is changing for this degree level, field, price point and post-graduation pathway.
The distinction between stocks and flows is equally important. A stronger visa flow can precede later enrollment, but it can also reflect timing and administrative processing. A stable active-record count can coexist with weaker new enrollment when continuing students form a larger part of the population.
No single national source identifies where an institution's own recruitment funnel is weakening. Institutions still need to connect inquiry, application, offer, deposit, visa-document issuance, visa outcome and arrival data at program level.
Implications for Students
A lower national count does not mean that admission to a particular institution or field is automatically easier. Aggregate movement says little about applicant concentration, program capacity, funding, selectivity or the academic profile of the pool.
Students should distinguish institutional demand from visa administration. A rise in F-1 issuances does not guarantee an individual visa result, and a national enrollment decline does not describe the current competitiveness of every program. Decisions should rely on current program requirements, cost, academic fit, funding, career outcomes and official visa guidance.
For families considering K-12 or undergraduate study, the scale of decline is useful context when evaluating peer networks and school support. It is not a substitute for school-level evidence on safeguarding, housing, progression, counseling and total cost.
Implications for Institutions
- Segment China recruitment by education level and program. Undergraduate, graduate, K-12 and OPT-linked populations should not share one volume assumption or one message.
- Use visa data as an operational signal, not an enrollment proxy. Track I-20 issuance, appointment timing, visa outcome, deferral and arrival separately.
- Distinguish composition from growth. A rising graduate or OPT share can result from faster decline elsewhere; it does not prove that the category expanded.
- Rebuild baselines after 2020. Pre-2020 inquiry and enrollment volumes are weak standalone targets when later source series show different paths and changed measurement conditions.
- Measure the institution's own funnel. National statistics cannot reveal whether a program's constraint is awareness, application completion, admission, price, visa timing or enrollment conversion.
The evidence supports a more selective recruitment strategy, not a blanket withdrawal from China. Open Doors still counted 265,919 China-origin students and OPT participants in 2024/25, but the relevant opportunity depends increasingly on program mix, price, student support and credible outcomes.
Sources
Primary sources
- IIE Open Doors: Academic Level and Places of Origin
- U.S. Department of State: Nonimmigrant Visa Statistics
- U.S. Department of State: Visa Counts and Methodology Differences
- U.S. Department of State: Monthly NIV Statistics and Non-Aggregation Notice
- ICE/SEVP: 2024 SEVIS by the Numbers
Related Howdy analysis
Data last reviewed: 25 August 2026. Final FY2025 visa detail, CY2025 SEVIS data and complete 2025/26 Open Doors China data were not used because they were not available in the evidence review. Monthly Department of State reports were not added together to create an annual total.